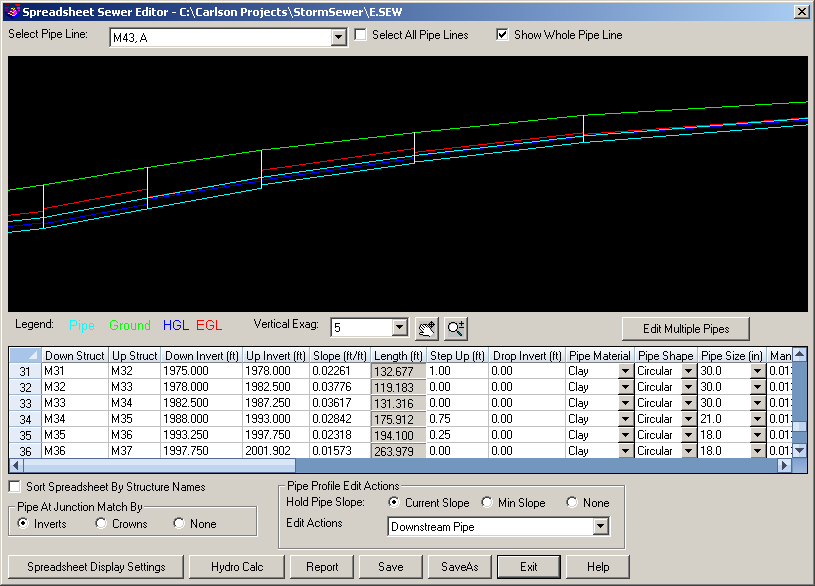
This command is an alternative method to the Edit Sewer Structure command for editing existing sewer networks in a tabular format. Data changes can be applied more quickly in the spreadsheet editor and the content and position of displayed data is customizable.
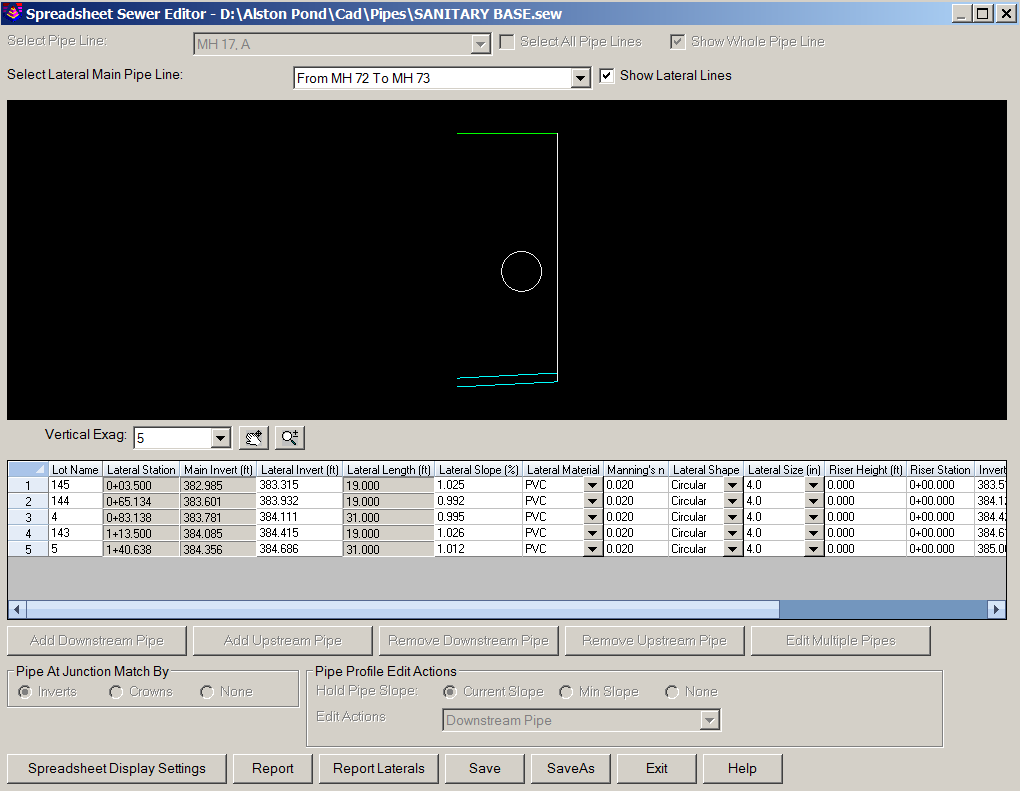
Show Lateral Lines:
Select Lateral Main Pipe Line
Select Pipe Line: Select the sewer reach that will be displayed in the dialog box or enable the Select All Pipe Lines toggle to display the entire sewer network.
Show Whole Pipe Line: When enabled, the entire sewer network reach of the selected pipe is displayed.
Vertical Exag: Indicate the desired amount of vertical exaggeration to be applied to the selected pipe display.
Edit Multiple Pipes: To globally change the value within a given column to a specific value, "click and drag" or use standard Windows shift+click functionality to select a range of cells within a given column and then click Edit Multiple Pipes.
Sort Spreadsheet by Structure Names: Enable this option if you would like to order the sewer network alphabetically by the structure names. When disabled, the data is sorted by connection order from downstream to upstream.
Pipe at Junction Match By: Indicate the method by which pipes are vertically aligned at each junction:
Pipe Profile Edit Actions: Indicate what should happen when Hydro Calc is clicked:
Hold Pipe Slope: Indicate how to manipulate the slope of the identified pipe(s):
Edit Actions: Set the desired method of how the sewer network should be adjusted when the Hydro Calc button is clicked.
Spreadsheet Display Settings: Enable the options for the value(s) you would like displayed in the Sewer Spreadsheet Editor and position each them using the Move Up and Move Down buttons.
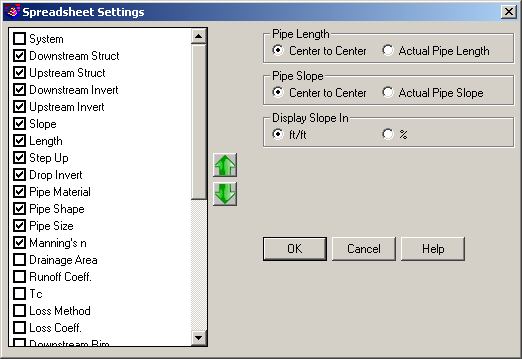
Pipe Length: Indicate the method that should determine the length of pipe; center of structure to center of structure or inside edge of structure to inside edge of structure.
Pipe Slope: Indicate the method that should determine the slope of the pipe; center of structure to center of structure or inside edge of structure to inside edge of structure.
Display Slope In: Indicate the unit of measure to be used for the display of the pipe slope.
Hydro Calc: The hydraulic calculations are performed on the network and the results are displayed.
Results: This option allows data or graphical reports of the network to be generated.
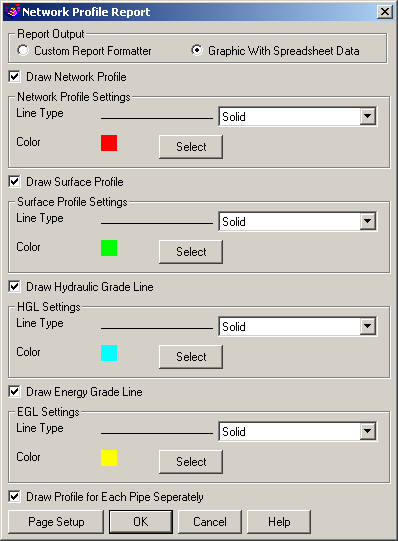
Report Output: Indicate the desired type of report output:
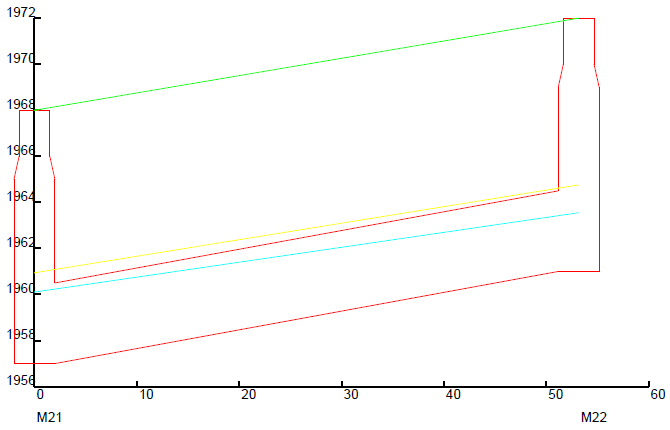
Draw Network Profile, Draw Surface Profile, Draw Hydraulic Grade Line, Draw Energy Grade Line: When enabled, the appropriate item is included in the graphical portion of the report and allows the Linetype and Color to be specified for each, respectively.
Draw Profile for Each Pipe Separately: When enabled, each pipe is detailed into the report as illustrated above. When disabled, each reach of the sewer network is drawn into the report.
Page Setup: Allows the look and size of the eventual PDF report to be customized using the standard Carlson PDF Report Generator.
Pulldown Menu Location(s):
Network
Keyboard Command: sizeswr
Prerequisite: A sewer (.SEW) file, a surface (.TIN, .GRD,
.FLT) file