This routine colors the 3D grid faces plotted in the drawing. It
uses the colors defined by layers, or in the strata definition file
and matches the names up with the intervals in the Geologic Model.
It is very useful for locating the outcrop of strata, or displaying
the subcrops of seams to a mining bench grid. This colored grid can
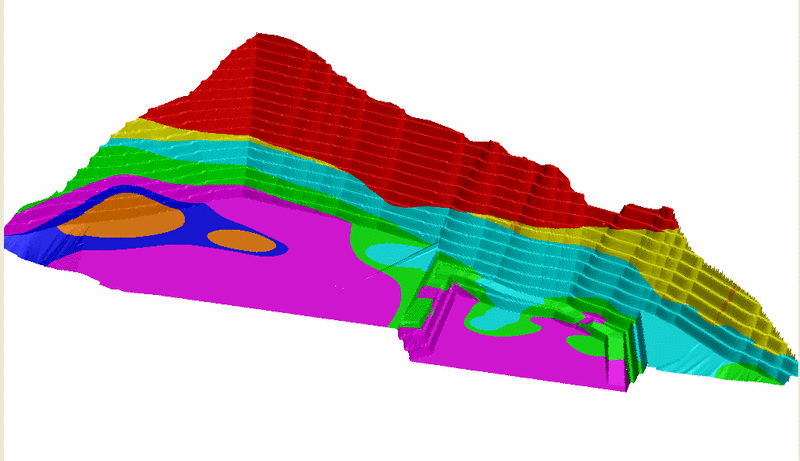
then be viewed in 3D and shaded for full visual effect. Shown below
is a final pit of a sand and gravel quarry. The grid has been
colored by the seams defined in the Geologic Model file. There are
options to set the subdivision tolerance. 0 will not subdivide the
grid cells. A max of 5 will subdivide the grid into very small
cells, for example, 50 x 50 grids will subdivide down to 1.5 x 1.5.
There is also an option to use the SDF file from Define Strata for
the coloring and layers.
Select the Geologic
Model file
Reading cell> 21364
Select 3D Faces to Process... type all or window the faces
Select objects: Specify opposite corner: 18340 found
Use Layers from Strata Definition File [Yes/<No>]? y
Enter Max Subdivision Level (0-5)<3>: 0
Select 3D Faces to Process...
Select objects: Specify opposite corner: 5005 found
Select objects:
Draw Legend [Yes/<No>]? y
Enter Legend Size <25.0>:
Pick Legend position:
pick
location for legend
Select objects: Enter to
accept
Keyboard
Command: strata_color
Pull-down Menu Location:
StrataCalc
Prerequisite: Need a 3D
Grid plotted in the drawing and a Geologic Model containing grids
that intersect the plotted grid.