
 3D Geologic
Columns using Color Strata By GPF (Grade Parameter File) option
with size by grade set in Define Grade Parameters
3D Geologic
Columns using Color Strata By GPF (Grade Parameter File) option
with size by grade set in Define Grade Parameters
As the name suggests, this command draws geologic columns for the selected drillholes in both 2D and 3D. There are many options for Draw Geologic Column that are specified in the dialog box. Once you have the settings the way you want, you can save the settings to a geologic column settings file (.geo) that can be loaded later. This settings file allows you to store different schemes of geologic columns. Each setting and option is described separately below.

Draw...: The geologic columns can be drawn In 3D, On 2D Grid or Next to the Drillhole. For the 3D method, the column is drawn vertically straight down (or at an angle if the Azimuth and Dip are defined for the drillhole)at the X,Y position of the drillhole. This 3D column can be drawn as a cylinder or as flat rectangles as in the 2D grid option except this time in 3D. The settings for 3D are in the 3D Options screen. The On 2D Grid option will prompt for a starting position and start drawing the holes in a line from the starting point. When using this option, the next row is active to select the alignment. The Next to Drillhole option draws the column on a 2D grid to the right of each drillhole.
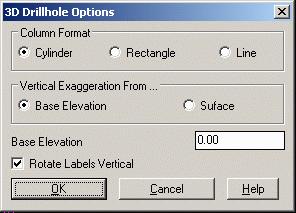
3D Options: The Column Format has two options to draw in
3D. The cylinder will draw faces that may be rendered in the 3D
viewer, while the Rectangle just draws 3D polylines of the
drillholes. The Line format simply draws 3D lines for the column.
The Vertical Exaggeration has two options for a starting point,
either the Base Elevation entered below, or the Surface.
The surface option will scale
the column elevations using the surface elevation as the base
point. The base elevation option uses the specified base elevation
as the scale reference. The base elevation method is useful for
combining the 3D geologic columns with other exaggerated surfaces
such as Block Diagram or grid files. For example, you could run
Plot 3D Grid Files for a strata elevation grid file with the
vertical exaggeration set to 5 : 1 with a base elevation of 500.
Then run Draw Geologic Column with the Horizontal Scale as 50 and
the Vertical Scale as 10 and the base elevation as 500. To view the
3D columns, use the Viewpoint 3D, Orbit or 3D Viewer Window
commands. The Rotate Labels Vertical controls whether to have the
labels facing up in plan view like regular labels or to face the
labels vertical for viewing in 3D.
3D Geologic
Columns using Color Strata By GPF (Grade Parameter File) option
with size by grade set in Define Grade Parameters
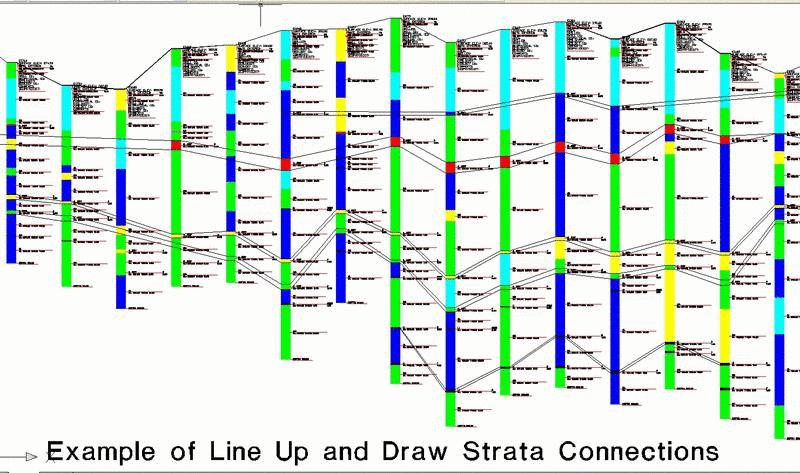
Align Horiz by...: For the On 2D Grid method, the location for the geologic columns can be picked individually, lined up or projected. The Individual option will prompt for the location to draw each drillhole. The Line Up option places the geologic columns at an even horizontal interval in the order that the drillholes were selected. For the Line Up method, the Space Scaler field determines the horizontal spacing between the columns. The spacing in drawing units is the Space Scaler multiplied by the Horizontal Scale. The Projected option determines the horizontal alignment by projecting the drillholes onto a polyline and then using the distance along the polyline as the horizontal alignment. Also the Projected option also can draw a surface profile polyline. An offset distance from the horizontal alignment polyline can be set to limit the drillholes selected to just those that fall inside the offset distance. The surface elevations of the geologic columns may not exactly match the surface profile if the drillholes are offset from the alignment polyline.
Space Scaler: When using the Line Up option, this scaler is multiplied by the drawing scale to determine the distance the columns are drawn apart.
Align Vert by...:
When using the 2D Grid or
Projected options, the geologic columns can be aligned vertically
by the real-world elevation, by the surface elevation, or by a
strata/bed top or bottom elevation. For example, aligning by the
top elevation of strata X would locate all the drillholes such that
the top elevation of strata X is drawn in a straight
row.
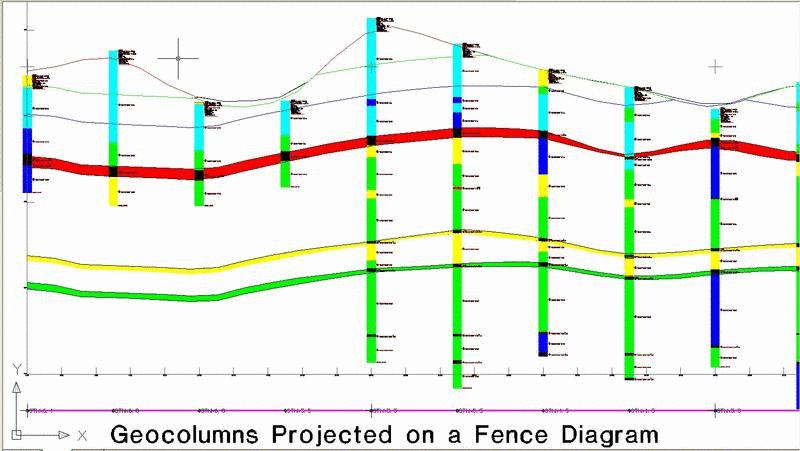
Draw on Fence Diagram: The geologic columns can be drawn on a fence
diagram. First run the Fence Diagram routine. Then run Geologic
Column and choose the Align Horizontally by Projected and Draw on Fence Diagram options. Also be sure that the horizontal
and vertical scales match the fence diagram scale. Then the program
will prompt you to select the fence diagram plan-view alignment
polyline and the drillholes. Then you pick the lower left grid
corner and enter the bottom elevation of the fence diagram grid.
The columns should appear on the fence diagram for a visual
comparison with the grids that made the fence
diagram.
Strata Name: This is the strata name that will be used for the above vertical alignment.
Bed Name: This is the bed name that will be used for the above vertical alignment.
From Top Elv and Bottom Elv: When using the Strata for Align Vert by option, this is the choice for alignment. Either line up the top or bottom elevation of the strata.
Horizontal Scale: The Horizontal Scale is the overall drawing scale that many of the options are scaled by. This usually matches the drawing scale set in Drawing Setup.
Vertical Scale: The Vertical Scale relative to the Horizontal Scale determines the vertical exaggeration. For example, a Horizontal Scale of 50 and a Vertical Scale of 10 would create 5 to 1 exaggeration. When the Draw Elevation Axis or Draw Depth Axis options are on, the program will draw a vertical elevation and/or depth scale to the left of the geologic column.
Grid Interval: The Grid Interval sets the tick mark spacing for the elevation/depth scales The Grid and Text Intervals can be used as the major and minor axis intervals where the Text Interval in the major and Grid Interval is the minor. The tick mark for the major interval is twice as long. For example, the Text Interval could be 25 and the Grid Interval 5.
Text Interval: The text Interval sets the elevation/depth label interval. The Grid and Text Intervals can be used as the major and minor axis intervals where the Text Interval in the major and Grid Interval is the minor. The tick mark for the major interval is twice as long. For example, the Text Interval could be 25 and the Grid Interval 5.
Draw To Sheets: This option will work if the options to Draw on 2D, and Align Horizon by individual are set. It draws the individual drillhole on multiple sheets, breaking it by pages set by the scale.
Draw CESO Sheets: This option was written for a specific company years ago. It draws the columns on their page form for printing.
Column Width Scaler: The Column Width Scaler determines the width of the geologic column by multiplying this value by the Horizontal Scale.
Text Size Scaler: The Text Size Scaler sets the text height of the labels by multiplying this field by the Horizontal Scale.
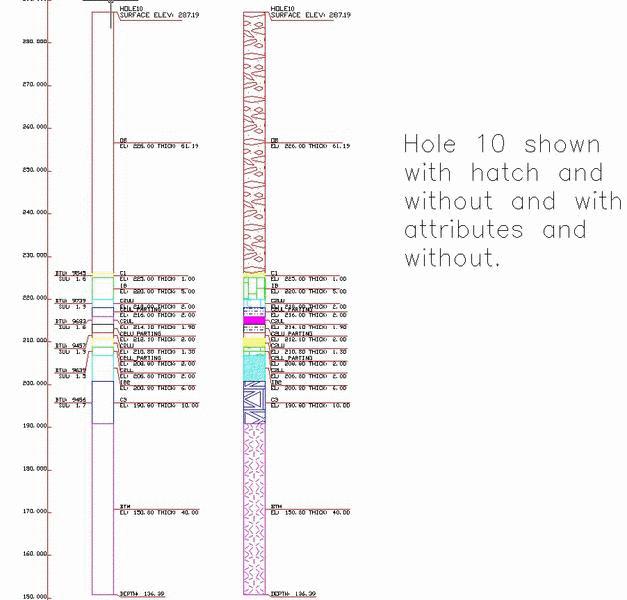
Hatch Scaler:
The Hatch Scaler is a scaler
multiplied by all the hatch scale values when using the Fill
By Hatch option.
Composite Strata to
Beds: This option
will composite multiple intervals into one strata by grouping them
together by bed name for drawing the column.
Group Entities:
Selecting this option will draw the drillhole entities as one, as a
block in the drawing. If this is off, then all parts of the column
are separate entities, such as polylines, hatch and text.
Offset from Drillhole:
This option is applied when the Draw, Next to Drillhole option is
selected. The value is a scaler, and is multiplied with the
Horizontal Scale to get the distance.
Specify Elevation Range - Top
Elev / Bottom Elev: The Specify Elevation Range option draws a section of the geologic
column within the range of elevations entered to the right.
Together with increasing the vertical exaggeration factor,
this option can be used to
highlight a section of the geologic column. This is used if the
entire drillhole does not need to be displayed.
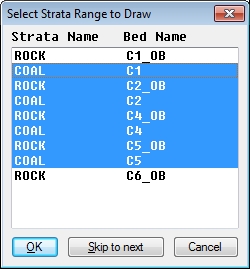
Specify Strata Range -
Thickness Roof / Floor: The Specify Strata Range option draws a section of the geologic
column within the range of strata. Together with increasing the
vertical exaggeration factor, Specify Strata Range can be used to highlight a section of the
geologic column. With the strata range option, the program will
show a dialog with a list of the strata. You can select multiple
strata in this dialog by highlighting the top strata and then
picking the bottom strata while holding hold the Shift key. Also
for the strata range option, you can specify additional thickness
above and below the strata range by using the Thickness Roof and Floor fields. this will add a "roof" and "floor"
interval to the column. The Skip to Next will refresh the list of
strata by looking at another drillhole with different strata
shown.
Draw Bar Graph-Use Red-Blue: The Draw Bar Graph option creates acid-base accounting graphs that are drawn to the right of the geologic column. These graphs are a logarithmic bar graph and a scatter graph. The strata attributes are used as the values for the graphs. The program will prompt for both a key and non-key attribute for the bar graph and the scatter graph. Negative values are drawn to the left on the bar graph and the range of the bar graph is -100 to 100. Values that exceed this range are drawn to the range maximum and then labeled with the real value. The range on the scatter graph is 4 to 8 and values that exceed this range will be drawn off the graph.

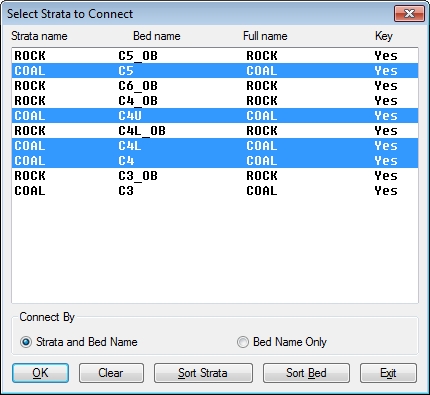
Draw Strata Connections:
This option will draw lines between the columns
to connect the selected strata or beds. This option will display a
dialog with a list of strata to choose to connect. Multiple strata
can be selected by using the Shift and Ctrl keys while picking the
names. The Connect By Bed
Name Only option will connect only strata that have a
matching bed name. Be aware it does not pinch the strata or bed out
if it does not appear in a drillhole, it will draw the line right
over the hole to the next one. Remove Polyline segment can be used
to clean up the drawing.
Draw Depth Axis:
This option draws a depth grid
next to each individual column, or just at the beginning of a row
of columns.
Draw Elev Axis:
This option draws an elevation
grid next to each individual column, or just at the beginning of a
row of columns.
No Label: This option will not label anything next to the columns.
Label Options: This button brings up the Label Settings dialog that sets the decimal precision and label prefixes for elevation, thickness and depth. You can also set the style for labels, strata label layer and attribute label layer. Label Strata On Single Line labels all the strata values on the same row which helps avoid overlaps. Use Full Strata Name will read the Define Strata settings and label the Full Strata Name found there. The Draw Ferm Codes option will label the ferm code next to the strata name either as the short ferm code name (i.e. "RSS") or as the ferm code full description (i.e. "Red Sandstone"). The ferm codes are defined in the Define Ferm Codes command and the ferm codes are assigned to the strata in the strata attributes. If Ferm codes are used and a corresponding strata attribute is defined, then the ferm hatch pattern, color and layer are used instead. Draw Label Leaders draws leader lines from the column to the labels. Label By Grade Parameters adds the grade name to the labels. These labels can be placed on either the left or right side of the column.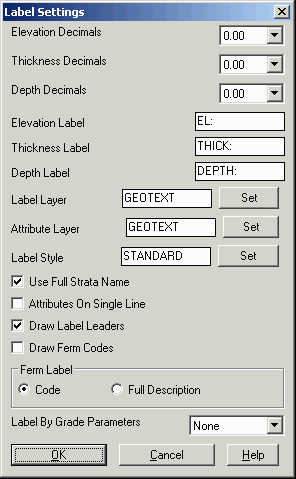
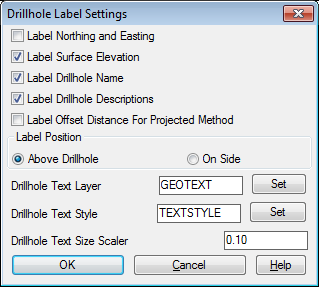
Drillhole Options: This button brings up the Drillhole Label Settings dialog with options whether to label the drillhole northing-easting, drillhole surface elevation, drillhole name and/or drillholes descriptions. There is also an option to label the offset distance from the projection line if the Projection alignment option is used. All of these labels are drawn at the top of the columns, near the collar. You can also set the layer, style and size with scaler, for the drillhole text labels. The drillhole labels can be drawn center justified above the column or to the right of the column.
Draw as: The MText
option will draw the text grouped together as MText (multiline
text). The DText draws labels as regular text entities for each
row. The MLeader option creates mleader entities that combine the
leader with the label.
Label Strata: This option
labels the strata names next to the columns and activates all the
labeling options.
Strata Thickness:
Turn this option on to label the
thickness of each interval next to the columns.
Label Bed: This option labels the bed names next to the
column. It may be used in addition to the Label Strata
Names.
Bed Thickness:
This will label the bed
composite thickness if there are more than one interval of the same
bed.
Label Strata :
To handle crowded strata labels,
there are several options for labeling the strata. The
All option labels all the strata. The
Key-Only option labels only key strata. The
Bed-Only option labels only the strata with bed
names. The Fit-Only
option labels only strata with
enough thickness to fit the label at the specified label size.
The Selected
option brings up a dialog with a
list of strata to choose from.
Label Strata - Elevations: This setting will label the top elevation, bottom elevation, or no elevation.
Label Strata Depths: This setting will label the top depth, bottom depth, or no depth.
Label Bed - Elevations:
This setting will label the top
elevation, bottom elevation, or no elevation.
Label Bed Depths: This setting will label the top depth, bottom depth, or no depth.
Strata Layer: This option is active if Strata Layer is set to NonKey Same, or All Same. The layer is entered here. Otherwise, each is drawn in a layer based on strata and bed name. The button next to the window brings up the list of layers to pick from.
Color Strata by Grade Parameter File:
This option will prompt for the GPF Grade Parameter file. The
interval of the drillhole will be colored according to the grade
color that is defined in the GPF.
Layer Strata:
There are three options to set
the layers for the entities. Individual will layerize them by the
strata names. Non-Key will put just the Nonkey strata on the layer
specified above. All Same will put all strata on the layer
specified above.
Fill by: Solid will fill the columns with a solid
fill. Outline will just outline the intervals with no fill or
hatch. Hatch will hatch the columns using the predefined hatches in
the Define Strata SDF file.
Use Specific Strata Definitions: This
option will allow for selecting a different Defined Strata file
than the one that is set current. Use this option and select a
different SDF file for layering, colors and hatching.
Select Attributes: If
the drillhole has attributes, they can be selected in the Select
Attributes window for labeling. They are drawn on the left side of
the columns. Key attributes are shown on the left, and Non-Key is
on the right side.

A legend for the strata hatch patterns can be created with the
Draw Legend function of Define Strata

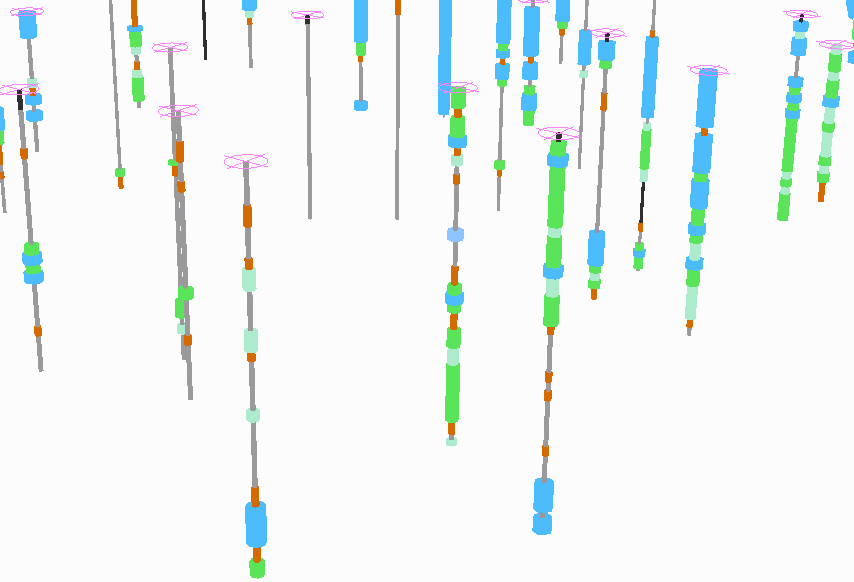
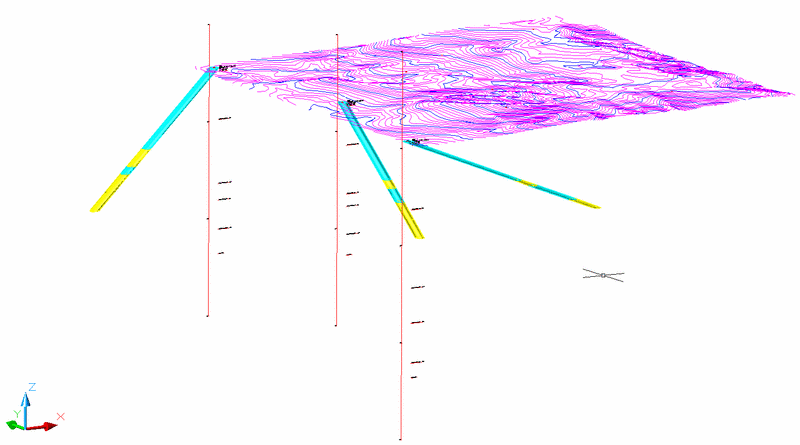
Angled
Holes:
Carlson will model angled drillholes. There needs to be two
attributes added to the drillhole. This is either entered under
Drillhole Description to apply the same azimuth and dip to the
entire hole, or as a Strata Description if it changes and varies on
the way down. The two attributes are SC_AZI and SC_DIP. These
represent the Azimuth and Dip of the drillholes. The Azimuth is
0-360 degrees. The Dip is 0-90, with 0 vertically down. Shown below
is a 3D view of geologic columns drawn, with the angles
shown.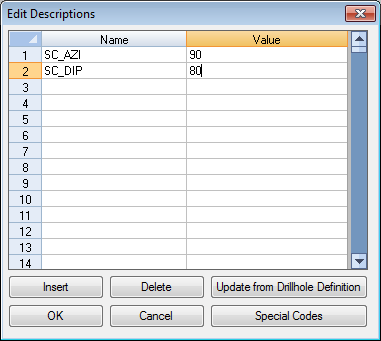
Geologic Column Settings dialog
Select DrillHoles for geologic column.
Select objects: pick the drillhole symbols
Select Attributes to Draw dialog
Pick location for geologic column: pick or enter the bottom
center point for the geologic column
Pulldown Menu Location: Drillhole
Keyboard Command: geocol