Range Diagram
The Range Diagram command is an interactive tool that displays
graphics which are dynamically updated when adding or editing
values in the spreadsheet text below. This is a quick and easy way
to find parameters such as pit width, or to size a dragline to fit
the geology. Output includes both drawing the sections in CAD and
printing out reports as PDF files, where each step is a separate
page. Each option is detailed below.
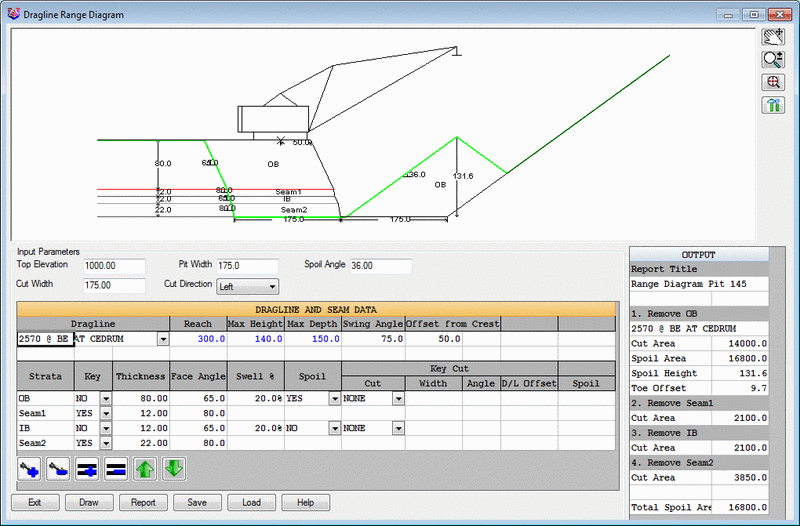 Input
Parameters
Input
Parameters
- Top Elevation: Sets the top elevation of the ground
surface
- Pit Width: Sets the width of the open pit. This could
be the previous pass, or a boxcut
- Spoil Angle: Sets the angle of repose of the spoil
pile
- Cut Width: This parameter is the width of the new cut.
This is the field that is frequently changed to see what pit widths
will work
- Cut Direction: This
determines whethere the cut is advancing to the right or left in
the graphics window. It is just a mirror image of either.
Dragline and Seam Data
- Dragline: This dropdown
displays a list of predefined draglines. These can be added and
edited with the separate command Define Dragline
Equipment.
- Reach: This displays the
horizontal reach of the selected dragline. Since it is colored
blue, it cannot be edited here.
- Max Height: This displays
the vertical dumping height of the selected dragline. Since it is
colored blue, it cannot be edited here.
- Max Depth: This displays the
vertical digging depth of the selected dragline. Since it is
colored blue, it cannot be edited here.
- Swing Angle: This parameter
controls the swing of the dragline. Enter in values from 0-90
degrees.
- Offset from Crest: This sets
the distance for the dragline center pin offset from the crest of
the highwall.
- Strata: This is the list of
strata added to the cross section.
- Key: The Key setting
controls whether it is waste (NO), and coal (YES).
- Thickness: This is where the
thickness of each strata or bench is entered. The section will
update graphically when a new value is entered.
- Face Angle: This setting
controls the highwall angle of each strata. It will update
graphically with any change here.
- Swell%: This is the swell
factor of the material as it is moved from in-place to the
spoil.
- Spoil: This option controls
whether to place the waste into the spoil with the dragline. If it
is pre-stripped and hauled away, or interburden removed with other
equipment, then the setting here would be NO.
- Key Cut
- Cut: The Key cut gives the
option to split the overburden block into two sections. The choices
are None, Left or Right. An image of Left and Right is shown here.
This allows for moving the dragline to get more spoil
distance.
Left
Key Cut
 Right Key Cut
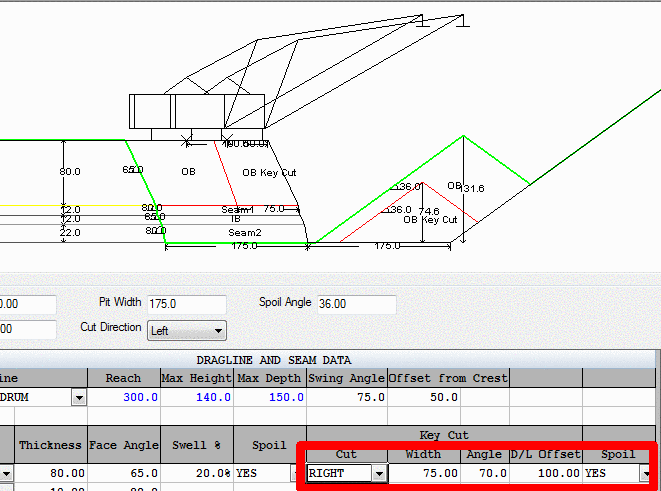
- Width: The width is entered
in to set the horizontal distance of the Key cut.
- Angle: This is the angle of
the key cut highwall.
- D/L Offset: This is the
distance for the dragline center-pin from the crest of the
highwall. It is usually more than the initial offset defined
above.
- Spoil: This option
determines whether to spoil or not. If it is hauled away by other
equipment, then this should be NO. If it is spoiled with the
dragline, then it should be YES.
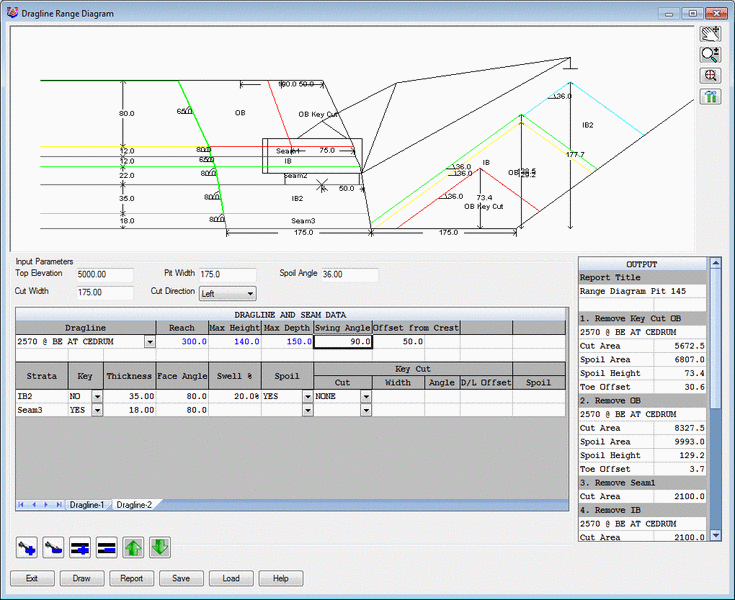
- Add Dragline (+): This option places the dragline on another
strata. It can be the same dragline on another pass, or it can be
another dragline if there are more than one working in that
pit. Additional Draglines
or passes show up as different tabs below the spreadsheet. Shown
here is the same dragline as dragline2, working on the IB3 seam on
another pass deeper in the pit.
- Remove Dragline (-): This takes away the dragline tab that was
added to the diagram.
- Add Strata (+): Use this button to add each strata to the
diagram, such as OB, Coal or interburden. Once it is added, then
pick in the cell to give it the proper name.
- Remove Strata (-): This takes away the strata that was added to
the diagram.
- Move Up or Down: This
moves the selected strata up or down in the section.
Graphics Window: The ground surface is color coded. When it
is green, then the spoil will fit into the pit and not cover the
coal.
- Pan: Pans around in the window
- Zoom: Zooms in and out in the
window
- Zoom Extents: Zooms the diagram to fit the entire display
window.
- Settings: This button
brings up the following dialog for settings:
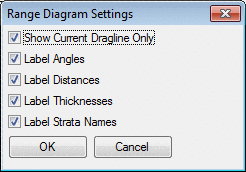
- Show Current Dragline
Only: This should be on to see the dragline locations with a
Key Cut, and also to see the other dragline locations on other
passes.
- Label: These options
will label the angles, distances, thicknesses and strata names in
the display window.
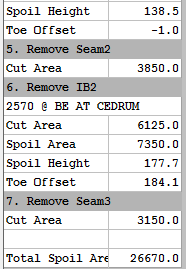
Output: The output shows up
in the lower right. It displays the area of the cuts and fills, as
well as dimensions of each step in the section. 
Draw: This option will draw the steps in CAD as polylines
with fill. It will prompt for the starting point in CAD to draw
them. Exit the command to see them in CAD. Here is an example of
what it draws, their colors and entities. 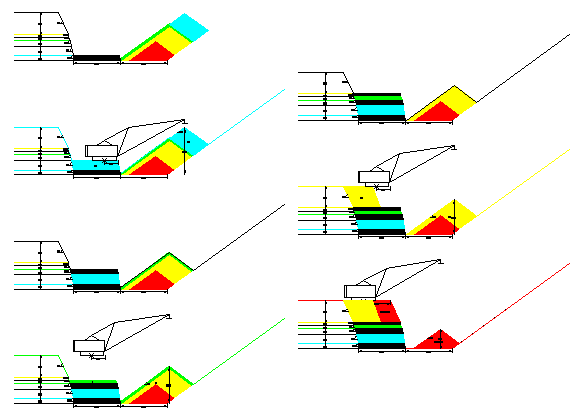
Report: The report button will create a PDF document where
each step in the section will be on a separate page. Then at the
end, one final page will show all the steps together with the
finished section. 
Pulldown Menu Location: Surface
Keyboard Command: ranged
Prerequisite: dragline equipment defined