

Draw Profile is a flexible
routine for drawing a profile anywhere in
the drawing. The profile may be drawn with or without a grid or with
just tick marks. The vertical curve annotations, for a road profile,
and manhole
annotations, for a sewer profile, may also be drawn. Draw Profile uses
the profile information that is stored in .PRO files. Once the profile
is
drawn using Draw Profile, the design and labeling routines of the
Profiles
dropdown are applicable to the profile. The first step in Draw Profile
is to choose a profile (.PRO) file.
If a profile of a Surface is selected, the Draw Generic Profile
dialog is presented, however if a profile of a proposed road design is
selected, the Draw Road Profile dialog is presented.
If the Draw Road Profile dialog is used, or if a proposed road
design Profile is added as 2nd or 3rd Profile to Draw in the Draw
Generic Profile dialog, a subsequent dialog is presented specifically
for the settings for drafting Vertical Curves. If no road design
profile is involved, the Vertical Curve settings dialog is not
invoked. If a Pipe profile is selected, a special dialog with
settings for drafting pipes and structures is presented.
Draw Grid: This option will draw a grid and axis elevations
for the profile. Pick Setup to access Grid Setup dialog.

Grid Direction: Profiles can be drawn Left to Right (the
default) or Right to Left. Although most profiles are drawn left to
right, if you have a road that runs east to west and you wish to draw
the profile stationing beneath the actual road stationing, then
choosing a Right to Left profile may be appropriate. Unavailable when
Draw Sheet is checked.
Grid Text Scaler: This text scaler is multiplied by the Drawing Scale set in the Drawing Setup command under the Settings menu, to determine the actual text height. For example, if the horizontal scale is set to 50, a text scaler setting of 0.1 will produce a text height of 5.
Draw Elevation Bar: Click on this option if you desire to have a vertical barscale displayed. It will run up and along the left-most vertical grid line of the profile.
Scale Label: Click on this option and you obtain a scale drawn at the lower left corner of the profile.
PVI 'V': This option plots a special "V" look above all
vertical curve PVIs (points of vertical intersection).
Ticks Only: If this option is selected, full grid lines are
not drawn. Instead, a fringe of ticks are drawn along the two vertical
axes
and the horizontal axis.
Offset Elevation Text: This option offsets the left-side vertical axis text a distance equal to the horizontal scale.
Offset Station Text: When clicked on, this option offsets the horizontal axis text by an amount equal to about 6 standard text characters, allowing the insertion of elevation or other information above the stationing. It is often used in conjunction with the Label Horizontal Axis options.
Station Text Orientation: This option allows you to specify
the orientation of the station text shown along the bottom of the
profile.
The example below shows both options:

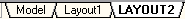
Draw Sheet: When checked, the profiles will be drawn in paper space. When used along with the Draw Plan options within Sheet Setup, plan and profile sheets can be created. In AutoCAD 2000 and later, each plan and profile sheet is created in it's own layout tab. When the plan and profile is drawn, you are placed in tilemode=0 and paper space. Click the "model" space tab (shown below) to return to model space to edit the plan view features, for example. The options within Sheet Setup become available when this toggle is checked on. Pick Setup to access the Sheet Setup dialog:

Layout Name: Enter a name for the paper space "tabs" to be assigned to each layout for each sheet. The program will automatically divide the plan view (if "draw plan" is clicked) and the profile view into sheet layouts, and if the length of the profile extends beyond a single sheet, then multiple layouts are created, with the layout name ID incremented by 1. If you enter "ms" to go to model space within a layout tab, you can pan to alter the plan view position. Its best to zoom in/out and edit within the Model tab. The Layout tabs appear at the bottom of the screen, along with the "Model space" tab to go back to standard plan view:
Block Name: This is the drawing name for the plan and profile sheet to be inserted. Carlson provides a standard plan and profile drawing in the form of Profile.dwg located in the Support subdirectory. You may wish to revise Profile.dwg, add your company logo, and re-save it as Profile1.dwg or you could add your own complete version of a Plan and Profile sheet. If you choose the latter, you should examine the scale, dimensions and the lower left corner of Profile.dwg, and try to duplicate those dimensions and corner coordinates in your own drawing. It is also important to store all your standard profile sheets in the Support subdirectory. You cannot draw Right to Left in Sheet mode. Note that the Sheet mode will re-orient the centerline left to right, which may cause text (such as the stationing) to plot upside down, until you use the Flip Text command under the Edit menu.
Sheet Width: This is the profile width, in inches, on the sheet. Even though the sheet is a fixed size, you can limit the length of the plot to 32 inches or less with this entry. If we used an entry of 16 for the example profile above, two plan and profile sheets would be created, because the first sheet would go from station 0+00 to 3+20 (16 inches at a 20 scale) and the second sheet would finish from 3+20 to 4+51.91. In English units, a typical entry here would be 30 for 30 inches.
Overlap Station: In multiple plan and profile sheet plotting, after the first sheet, all subsequent sheets will have the first 2 stations in common with the last 2 stations on the previous sheet, if the Overlap Station option is turned on. For example, if the last 2 stations are 3+10 and 3+20 on sheet 1, then sheet 2 will start with 3+10, then 3+20, with this option turned on. With this option turned off, if the first sheet ends with 3+20, then the second sheet would begin with 3+20.
Draw Plan: With this clicked on, you are asked to select the polyline that represents the centerline, and the program best fits the centerline in the plan view portion of the plan and profile sheet, then captures all of the associated drawing that will fit in that paper space window. If the length of the polyline divided by the scale exceeds the Sheet Width entry (for example, 5000 feet of road divided by 50 Horiz. Scale is 100, which exceeds the sheet width), then multiple plan and profile sheets will be automatically created. A 5000 foot road at 50 scale with a 30-inch sheet width, would lead to 3 full sheets of 1500 feet each and a "leftover" fourth sheet showing the last 500 feet.
View Lower Y: This sets the lower position of the paper space window for the plan view. With Lower Y set to 9 (inches above the base of the sheet) and Top Y set to 21, there is a 12 inch vertical window, running the full Sheet Width (typically 30 to 32). This window for the plan view can be expanded or reduced with these settings.
Top Y: This sets the top vertical limit for the plan view window, measured in inches from the bottom of the plan and profile sheet.
Scale 1:1: With this clicked off (the default), the profile will draw in scaled units (e.g. 1"=50'), with a 1500-foot profile measuring 1500 feet. With this clicked on, the units will be 1:1. A 30-inch profile sheet will measure 30 units, even though the centerline and profile may be 1500 feet in length. If the Scale 1:1 option is turned on, then you cannot check the distances of features using commands such as Bearing and Distance on the Inquiry menu, because the distances will be scaled down by a factor equal to the drawing scale (for example, at 1"=50', the reduction in scale factor is 1/50 or 0.02). You can set the absolute starting coordinate for the 1:1 scaled plot by setting the Sheet Lower X and Sheet Lower Y.
Fit Each Vertical: With this option turned on, the command will recognize the lower and upper vertical elevations of the profile and set the vertical axis elevation range to enclose the actual elevation limits of the profile. With this option turned off, you can enter the lower vertical elevation range, dropping it down further to increase the lower margin. Whether or not the Fit Each Vertical option is turned on or off, you are always prompted for the top elevation range.
Tile Sheets: If clicked on, only one Layout is created in paper space, and all sheets appear in this single Layout as tiles of individual sheets, much like the tiles mode of viewing files within Windows Explorer.
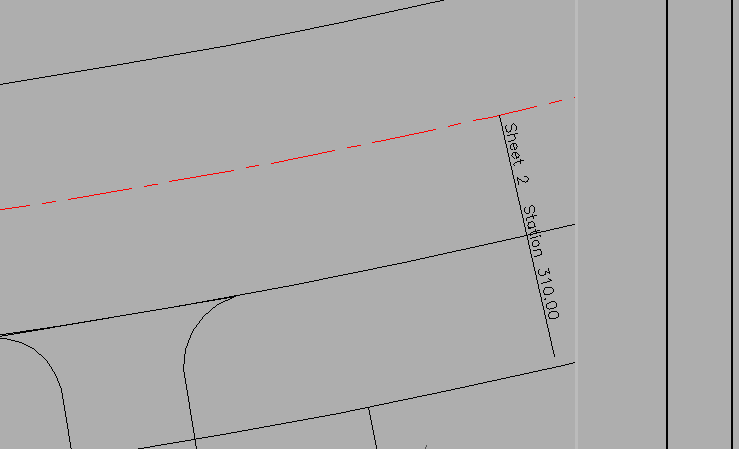
Label Match Line: When clicked on and multiple sheets
are
plotted with plan view option on, a match line will plot in the plan
view.
Bottom Vertical Spacing <0.0>? press Enter
The program places the profile plot flush against the bottom of the vertical grid, by default. This prompt allows for an offset, moving the profile plot up off the bottom of the grid. If the lowest elevation of the profile is 940 by default, entering 10 would start vertical axis labeling at 930, and if the vertical scale was 5 units, this would push the vertical plot up 10 units or 2 standard grid intervals.
Top Elevation of Profile Grid <945.0>: press Enter
Cl File/Select polyline that represents centerline: Select
the centerline polyline (if Draw Plan has been clicked on).
Beginning Station <0.0>: press Enter
The items below refer again to the profile options that are
independent
of the Draw Sheet option:
Draw Horiz Axis Elev: This
option creates elevation labels along the horizontal axis. Pick
Setup to access the Horizontal Axis Elevations settings dialog.

Draw Horiz Label Box: This option draws a boxed area underneath the profile. It is best used in standard Draw Grid mode, with Draw Sheets clicked off. Pick Setup to access the Horizontal Label Box Setup dialog. An example of the resulting plot is shown here:


Draw Break Point Elev: Will label these values along the profile line above each break point in the profile. Pick Setup to access the Break Point Elevation Setup dialog.

Draw Break Point Desc: Will label these values along the profile line above each break point in the profile. Pick Setup to access the Break Point Description Setup dialog.

Starting Station: This field defaults to the starting station in the selected profile(s). If changed, the starting station can move forward, clipping out the first part of the profile. When you are not plotting sheets, you must set the starting station to the end of the previous sheet's ending station to force a multiple sheet layout.
Ending Station: This field defaults to the ending station in
the selected profile(s). A profile that is 3000 feet in length could be
plotted in 2 parts, first station 0 to 1500, then station 1500 to 3000,
using the Starting Station and Ending Station options.
Label Text Scaler: This sets the size of text used for
vertical curve annotation to the horizontal scale times the scaler,
when you are
working in English units. In metric units the text height would be
0.01*horizontal scale*scaler.
Link To Files:
This setting controls the linkage of the plotted profile(s) to the
actual
profile file(s) (.PRO), determining how changes to the file affect the
plotted profile(s). If set to Off, there is no linkage, Prompt
will
ask whether to update the plotted profile(s) when the file changes, and
Auto will automatically update the plotted profile(s) when the file
changes.
Match Line Elevations: For high relief profiles that might
otherwise extend up and into the plan view portion of the drawing, the
Match Line
Elevations option can be used to break the profile and redraw the
remaining
portion with its own vertical scale, as seen above.
Elevation Range: This is the range of elevations that is used
in conjunction with the Match Line Elevation option. If the range is
exceeded (that is, if the range above is 20), the program will break
the profile
and draw the remainder with a separate vertical axis range.
Grid Scale and Interval Settings
Horizontal Scale: This scale applies primarily to text size. If the text scaler is 0.1 and the horizontal scale is 50, then text size will be 0.1 * 50 = 5.
Horizontal Grid Interval: This sets the spacing of the grids that run vertically from the horizontal scale.
Horizontal Text Interval: This sets the spacing of the stationing text that appears along the horizontal axis. When using a large "Axis Text Scaler", the horizontal axis text can become too large, and it often necessary to space the horizontal text interval at twice the horizontal scale.
Vertical Scale: This scale sets the vertical exaggeration of the profile. If the horizontal scale and vertical scale are the same, then the vertical is not exaggerated. Profiles are often plotted with a 5 or 10 vertical exaggeration. For example, the horizontal scale may be 50, but the vertical scale may be 5.
Vertical Grid Interval: This sets the spacing of the grids that run horizontally between the vertical axes on the left and right side of the profile.
Vertical Text Interval: This sets the spacing of the
elevation text that appears along the vertical axes.
Profiles to Draw: This portion of the Draw Profile dialog
box
allows up to 3 profiles to be selected and plotted simultaneously.
These
profiles can be distinctly layered using the Layers button at the base
of the dialog box. If the goal is to plot more than 4 profiles on the
same
drawing, run the Draw Profile command a second time, and specify up to
3 more profiles, choosing the same scaling and lower left corner for
placement. Be sure to turn off Draw Grid when placing additional
profiles on a pre-drawn
profile. Otherwise the grid and axis text may be drawn more than once.
Layers, Colors, Text Styles and Linetypes buttons provide access to
settings for each of these features of the profiles.


Load Settings: Loads a saved collection of Draw Profile
settings, saved in a (.PFS) file.
Save Settings: Saves all Draw Profile settings in a (.PFS) file.
Erase existing profile from drawing [<Yes>/No]? N This prompt appears only if you
have previously drawn the profile.
Next a dialog appears to set the Profile Grid Elevation Range by
specifying the Top and Bottom Elevations. Adjust as desired, pick
OK.


Include K-value: This option is a function of the change in
slopes on
either side of the point of vertical intersection.
Include Sight Distance: This option is computed by the delta
slope and
is a function of whether the vertical curve is a sag or a crest.
Include Grade: This option draws slopes along the tangent
portion of the vertical curves, with slope direction arrows.
Draw Vertical PVC and PVT Lines: This option draws vertical
lines emanating from the PVC and PVT of all vertical curves.
Position Text Below Line: This option draws the PVC, PVI, and
PVT information under the picked location for the vertical curve
labeling.
Number of Decimal Places: Choose the decimal precision used in the elevation and stationing annotation for vertical curves.
Next, select a point vertically that corresponds to the position of the left-right lines under which is written percent grade and above which is written the vertical curve length, sight distance, and K-factor, if requested. The PVC, PVI, and PVT stations and elevations are written above or below this picked point depending on dialog box settings.
Additional Prompting for Multiple Profiles
Detected multiple profiles within C:\CARLSON
PROJECTS\2006-0124\DATA\PRO\EXAMPLE.PRO Note that the Profile from Surface
Entities command can store
additional profiles into the same profile file.
Draw profiles on same or different grids (Same/<Different>)? press Enter This determines
whether the multiple profiles will be drawn together on
the same grid or drawn on separate grids.
Uniform or variable grid size (Uniform/<Variable>)?
press Enter This selects between one-size-fits all grids or
individually sized
grids for each profile.
Keyboard Command: drawprof
Prerequisite: A .PRO file
File Names: \lsp\drawprof.lsp, \lsp\profile.dcl,
\lsp\vcplot.lsp,
\lsp\endsewer.lsp