This routine draws ticks on the axis and/or interval dots on an
existing
grid.
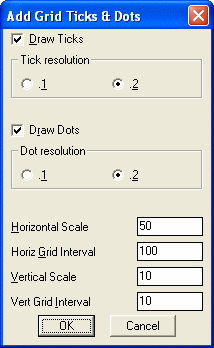
Add Grid Ticks & Dots dialog
Specify whether to draw the ticks and/or dots, and choose their
resolutions
(.1 or .2). Also, make sure the grid parameters match the grid that
you're
working on.
Pick Lower Left Corner of Grid: pick the corner
(endpoint
snap is on)
Pick Upper Right Corner of Grid: pick the corner
(endpoint
snap is on)
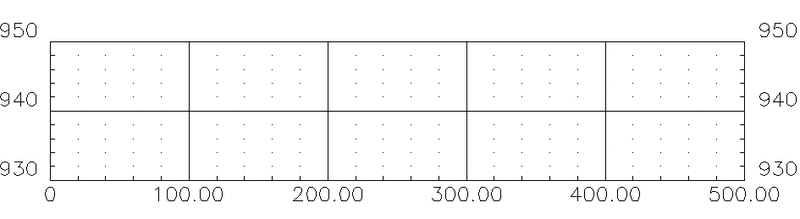
Grid ticks and dots with metric
stationing (no '+') as set in Profile Defaults
Pulldown Menu Location: Profiles > Profile Grid
Keyboard Command: tickdot
Prerequisite: A profile grid
File Name: \lsp\profile.dcl